Portfolio · Proof of Work

Real work.
Real numbers.

Google AdsMeta AdsPaid AcquisitionROASRevenueGrowth
01 / 05 · Paid Acquisition

Account Performance.

Google Ads performance view · December 2025 · Metrics shown directly from the supplied account screenshot.
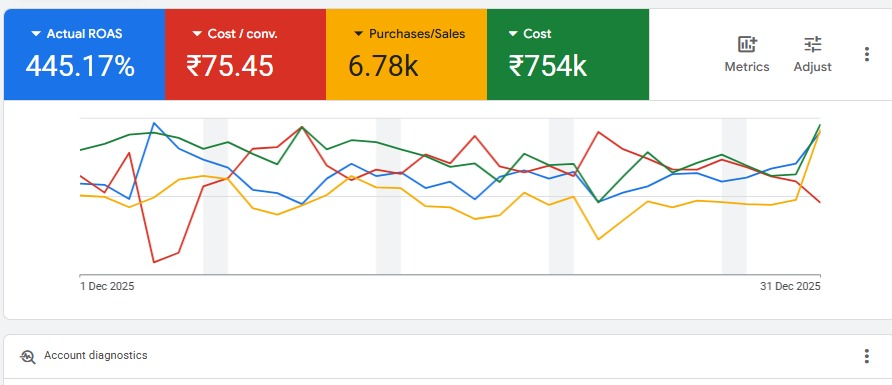
445.17%Actual ROAS
₹75.45Cost / conv.
6.78KPurchases / sales
Google Ads account performance showing 445.17 percent actual ROAS, ₹75.45 cost per conversion, 6.78K purchases or sales and ₹754K cost in December 2025
CHIRAG SHARMA
Google Ads · 1 Dec 2025 — 31 Dec 2025

What I did

Managed performance around the numbers that matter: ROAS, conversion cost, purchase volume and spend efficiency. The account was monitored through the period to identify where budget was producing the strongest commercial return.
Monitored ROAS and cost per conversion.
Tracked purchase/sales volume against spend.
Used account-level performance trends to guide optimization.
Focused on scalable acquisition without losing efficiency.
Result shown in screenshot

445.17% ROAS

December 2025 account snapshot: ₹754K cost, ₹75.45 cost per conversion and 6.78K purchases/sales.

02 / 05 · Lead Generation

Lead Acquisition.

Google Ads performance view · 28 July 2025 — 29 December 2025.
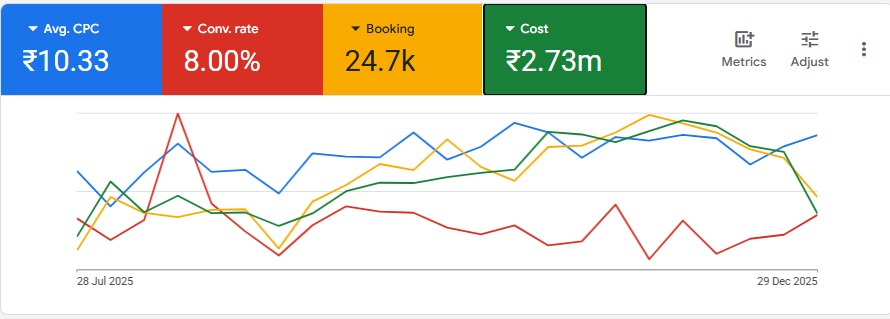
₹10.33Avg. CPC
8.00%Conversion rate
24.7KBookings
Google Ads performance screenshot showing ₹10.33 average CPC, 8 percent conversion rate, 24.7K bookings and ₹2.73 million cost from July to December 2025
CHIRAG SHARMA
Google Ads · 28 Jul 2025 — 29 Dec 2025

What I did

Focused on balancing traffic cost, conversion rate and booking volume while scaling the account over the period shown. The goal was to keep acquisition efficient as volume increased.
Optimized campaigns around conversion intent.
Watched CPC and conversion-rate movement together.
Allocated spend toward stronger-performing demand.
Used booking volume as a core growth signal.
Result shown in screenshot

24.7K bookings

Account snapshot shows ₹2.73M cost, ₹10.33 average CPC and an 8.00% conversion rate across the displayed period.

03 / 05 · Revenue Growth

Sales Growth.

E-commerce sales timeline · January 2026 — March 2026 · Supplied analytics screenshot.
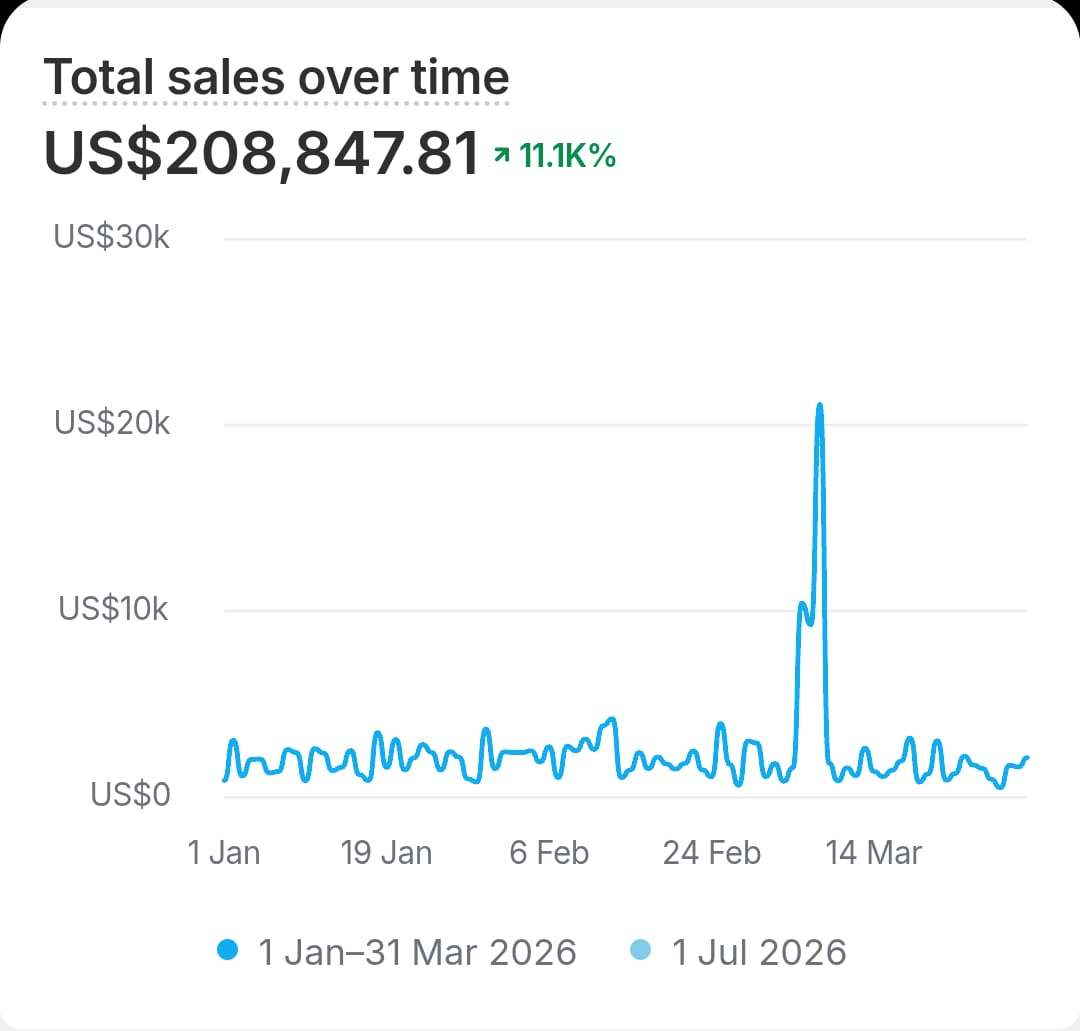
US$208,847.81Total sales
11.1K%Growth shown
Q1 2026Timeline
E-commerce total sales over time screenshot showing US$208,847.81 and 11.1K percent growth for January to March 2026
CHIRAG SHARMA
Sales timeline · 1 Jan — 31 Mar 2026

What I did

Worked from the commercial outcome backward — connecting paid acquisition, conversion and sales performance instead of treating ad metrics in isolation. The timeline is used as the proof point for the growth period.
Tracked sales movement over time.
Connected acquisition decisions to revenue.
Reviewed performance trends to identify scale opportunities.
Optimized toward commercial outcomes, not vanity metrics.
Result shown in screenshot

US$208.8K sales

The supplied sales timeline reports US$208,847.81 in total sales and shows 11.1K% growth for the displayed comparison.

04 / 05 · Revenue Performance

Revenue Timeline.

Additional sales-performance view from the supplied analytics evidence.
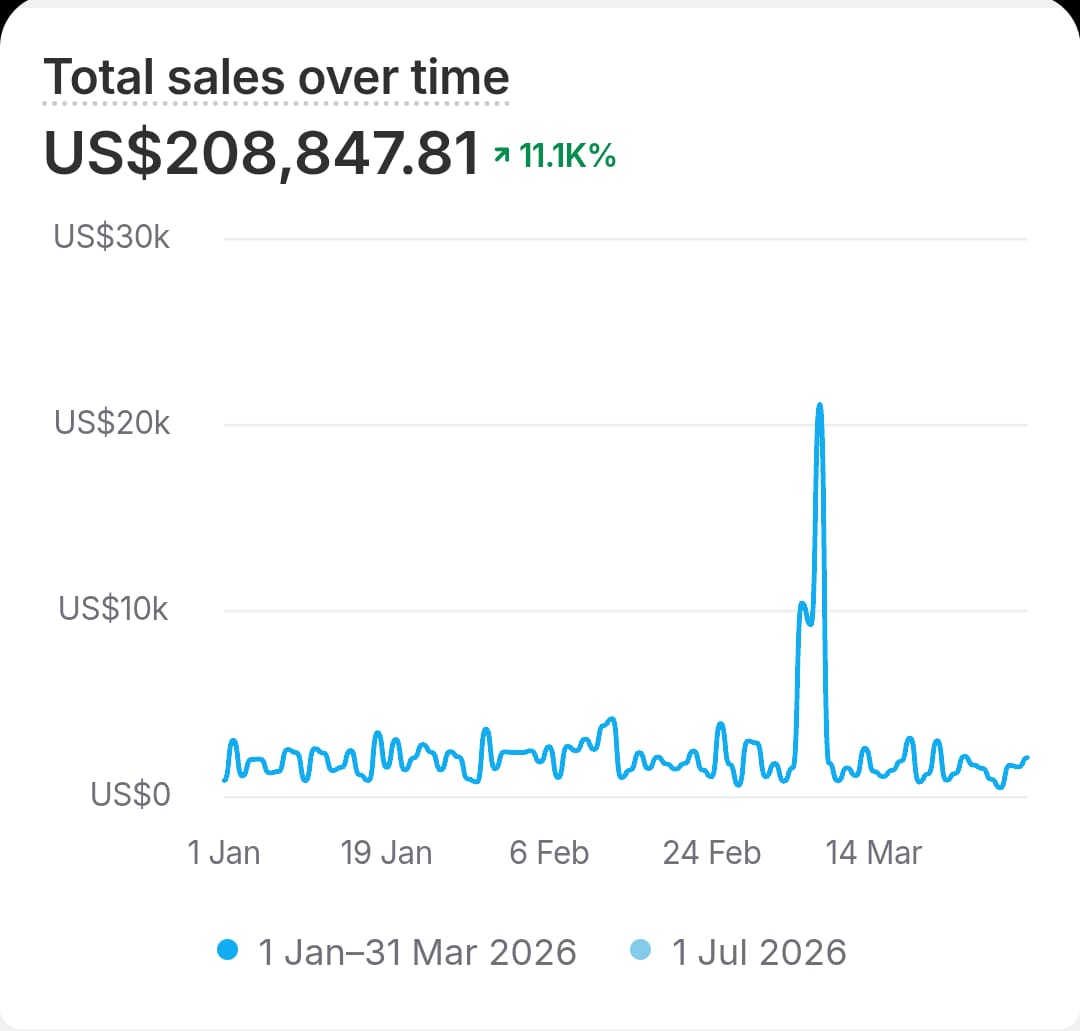
US$208,847.81Total sales
11.1K%Growth shown
Jan–Mar2026 period
Supplied sales timeline screenshot showing US$208,847.81 total sales and 11.1K percent growth
CHIRAG SHARMA
Sales timeline · supplied account evidence

What I did

Used the revenue timeline as a direct decision-making signal: identify periods of acceleration, understand what was driving them, and use that information to guide the next round of acquisition and optimization.
Reviewed revenue trends by date.
Looked for repeatable performance patterns.
Prioritized actions tied to sales output.
Kept optimization connected to business revenue.
Result shown in screenshot

US$208.8K sales

This is the additional supplied view of the same sales timeline, preserved as provided rather than creating unsupported metrics.

05 / 05 · Personal D2C Project

30-Day Experiment.

Personal D2C / dropshipping project · August 2026 · Paid acquisition and funnel optimization.
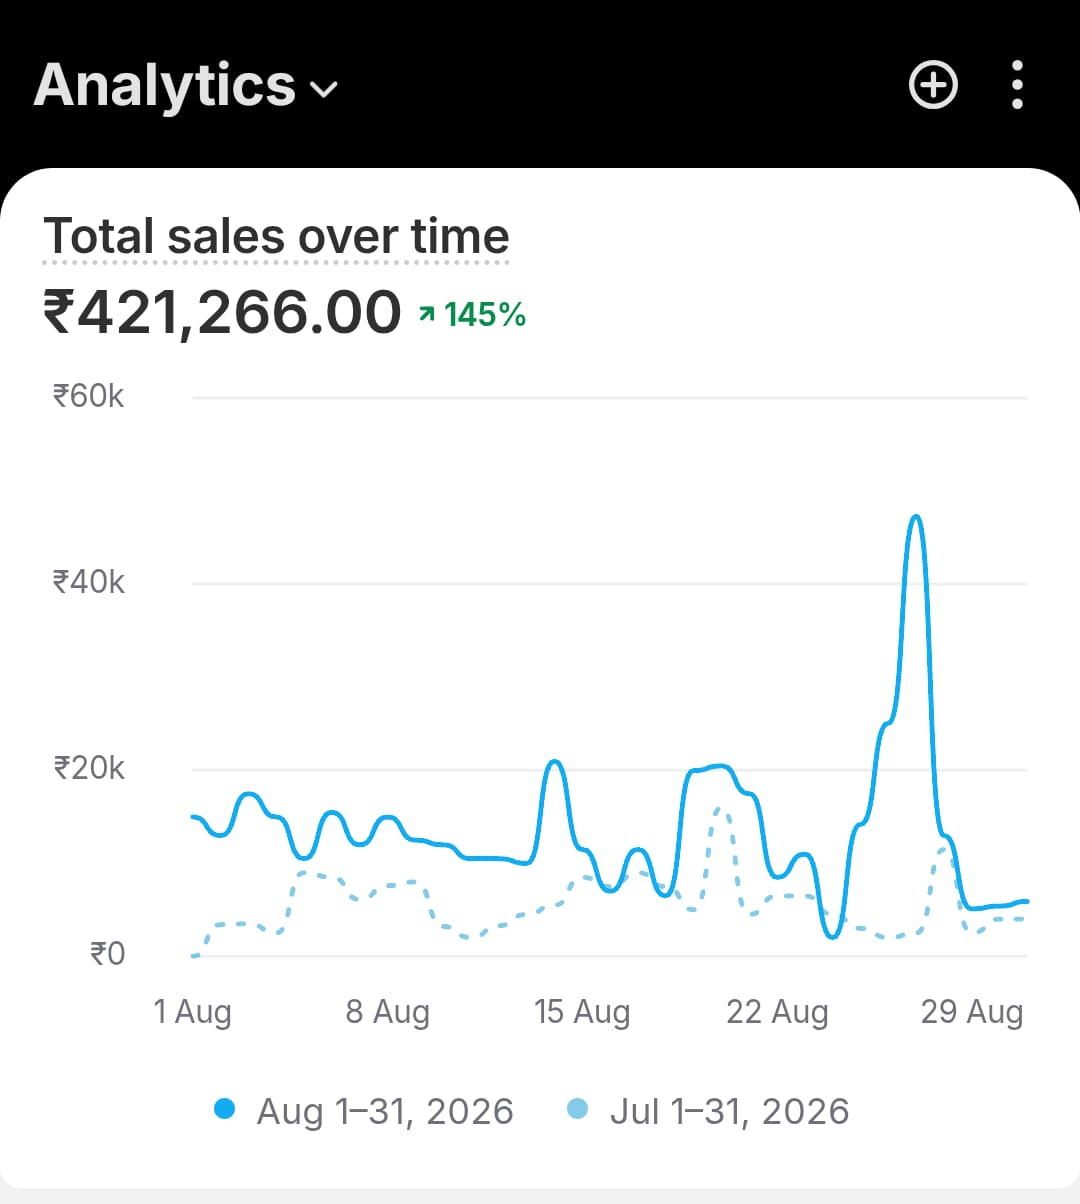
₹4.21LTotal sales
145%Growth shown
Aug 2026Timeline
Analytics sales timeline screenshot showing ₹421,266 total sales and 145 percent growth for August 2026 compared with July 2026
CHIRAG SHARMA
Sales timeline · Aug 1 — Aug 31, 2026 · +145%

What I did

Built and tested the D2C funnel end-to-end, from product and offer testing to paid acquisition, creative iteration, conversion analysis and unit economics. The project was designed to find a profitable acquisition path quickly.
Tested product and offer combinations.
Iterated creatives and paid acquisition.
Optimized the purchase funnel and conversion path.
Monitored revenue against paid media economics.
Result shown in screenshot

₹4.21L sales

The supplied August 2026 analytics timeline reports ₹421,266 in total sales and shows 145% growth versus the comparison period.

Performance marketer · India

Let's turn the next
budget into growth.

Back to home ↗